

The fastest way to create beautiful custom analytic reports and dashboards based on your requirements while using your OLAP, SQL, and CSV data sources, to share them and collaborate with other users.
A business intelligence platform (BI) is a technology that enables enterprises and organizations to build effective data analysis, visualizations, and key-data discovery applications. It transforms data from existing data sources to meaningful, easy-readable reports and dashboards, presenting the most important business metrics with the ability to focus and discover more details on various aspects of the business.
A business intelligence Platform is using analyses, reports, KPIs, scorecards and dashboard elements to provide current business insights and monitor defined goals.

An important aspect of a Business Intelligence Platform is to define a set of Key-Performance-Indicators that will present the current business goal status based on the data from existing data sources.
Molathati provides a KPI management solution to maintain and share KPI insights, create alerts on important KPI thresholds and organize KPIs into Scorecards.
Molathati BI Server delivers comprehensive OLAP analysis for your Multidimensional and Tabular OLAP models within your browser with fast asynchronous responses and intuitive user interface. Quick product setup, OLAP standard analytic features, visual analysis, OLAP Reports, and OLAP Scheduled Reports subscriptions are key features of Molathati Business Intelligence.
Convert your analysis to PDF or Excel file, share with your team or subscribe to fresh data at the scheduled time. Analyze OLAP data with descriptive Grid view or visual Chart view.

Transform SQL query results (or CSV files) to Analytic Models for self-service data exploration, analytics and visualizations and sharing with other users. Drag-and-drop user-friendly creation of analysis, reports, and dashboards based on OLAP data or ‘Analytic Models’.
Easy to learn process of Self-Service BI (data modeling, analysis and visualization), each end-user can adopt with no special training or BI skills.
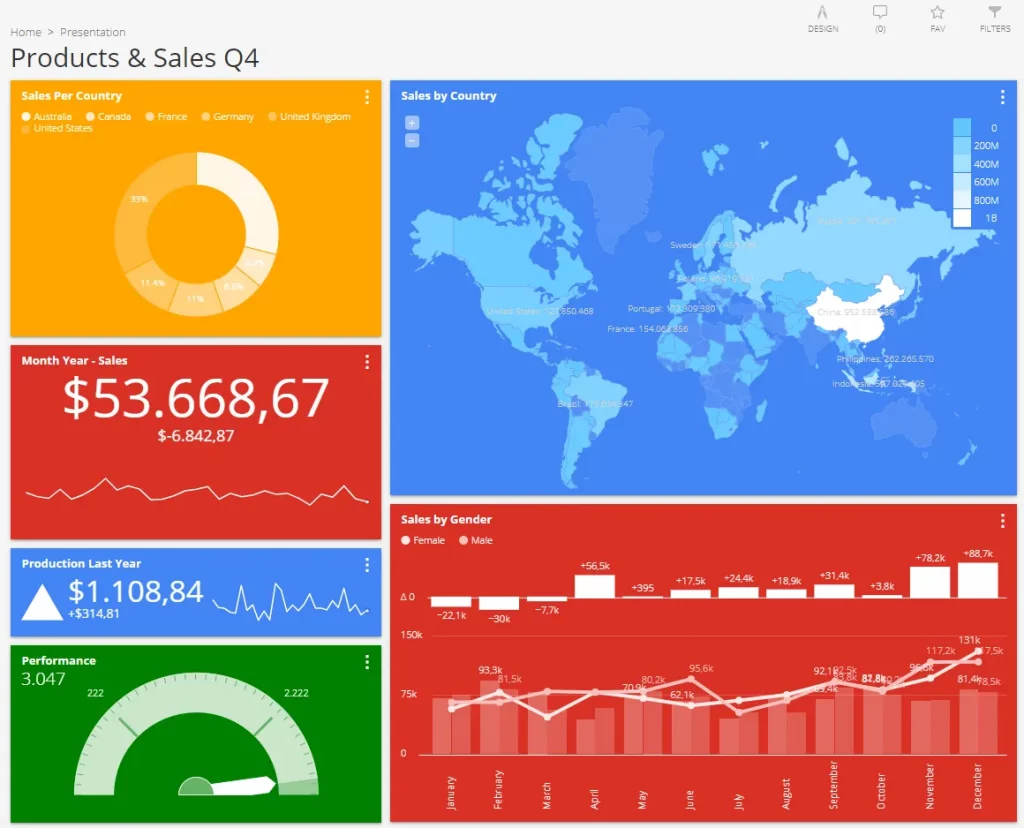
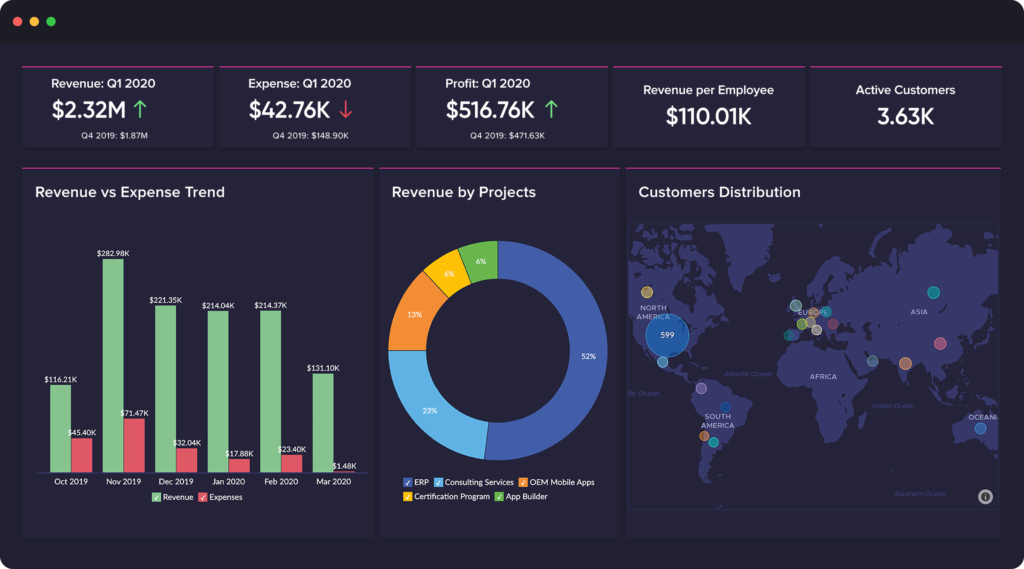
BI Dashboard Tools to create important insights based on data from your SQL and OLAP databases are quickly designed to present most valuable information from your business environment. Use Molatahti Dashboard Software to create KPI or Gauge Metrics, 20 different dashboard visualizations, interactive dashboard filters, and OLAP actions or collaborate using comments with your team.
Share analytic Dashboards with authorized users on local intranet or internet, subscribe to Dashboards and receive fresh data at the scheduled time. Apply dashboard filters, enlarge dashboards tiles, convert dashboard to PDF file.
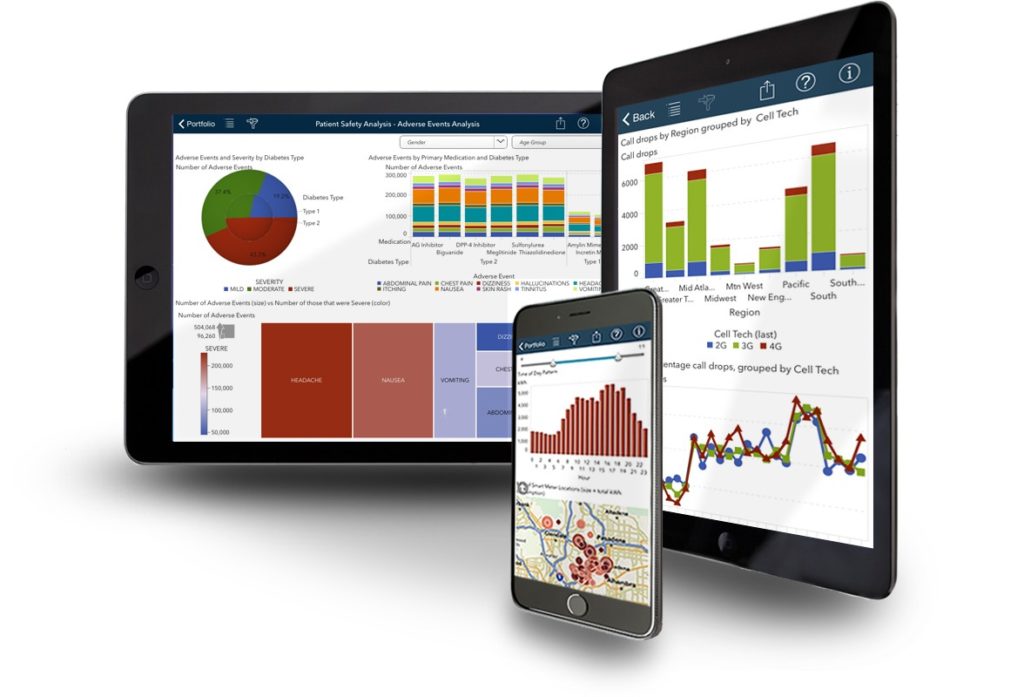
Embedded BI and Embedded Analytics within your environment to use the power of data analysis and visualizations, working together with your application requirements.
Use HTML/Javascript level embedded analytics options to bring Kyubit features to your site. Find out all embedded BI possibilities on our website or contact us for specific integration options.